Data reporting can take many forms, not all of which serve up charts and graphs and visualizations on a silver platter or mobile device screen. In fact, databases that consume countless hours of wrangling may even remain unpublished. However, insights gleaned from organizing and questioning that information can make headlines.
Computer-assisted reporting (CAR) teaches its practitioners that even narrative information can be “structured” — that is, arranged in rows and columns, similar to the way numbers are put into spreadsheets for calculation. When information is well organized, it can be analyzed. And when analyzed, narrative databases can yield important revelations and opportunities for good journalism previously hidden in plain sight.

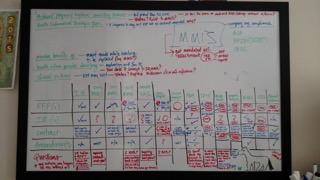
With a “narrative database” approach, I worked with Vermont Public Radio to build a comprehensive database of IT projects across state government. (Illustration by Amanda Shepard / VPR.)
In a project I recently completed with Vermont Public Radio, we attempted to quantify all the state’s spending on information technology. Note my use of the word “attempted.” We did not prevail in our original goal because (long story short) Vermont state government simply does not organize its IT spending data in a way that makes such analysis possible.
Hence, our pivot: If we couldn’t find out all we wanted, we’d find out what we could.
What we discovered was that information about IT spending across state departments is woefully unorganized and inconsistently maintained. The same project may be called one thing by one department, and another by a different office. Some projects were classified as IT-related by certain employees, but not by their colleagues. The department responsible for statewide information technology reported things like implementation costs and operating costs and projected five-year costs, but on different pages of the same report, so no one could see a project’s cost cycle and current status all in one place.
Getting the data into shape was daunting: We had over three dozen fields for about 450 very messy records that required more manual labor to clean than I care to recall. The only way to make sense of this muddled mass was to structure it. Without structure, there was no story — not even lucid questions.
In this case, structuring the data meant rooting out duplicate listings of single projects called various names by different departments. It meant determining which department various projects belonged to when none were listed. It meant asking for information two or three times, verifying answers, keeping track of corrections and merges. It even meant leaving some fields blank when, for example, IT projects we identified through public records requests had been excluded from official cost projections.
Ultimately, the database we compiled was accurate and, predictably, incomplete. Due to the inconsistent methods in which information about each project had been collected by the state, no amount of cleaning on our part could extract reliable calculations from it. There would be no charts, no graphs, no visualizations.
But oh, the story: “Huge Money, Small Oversight: State IT Spending In Vermont.”
In a nutshell, VPR reporter Taylor Dobbs explained that it’s nearly impossible to know how much public money goes toward publicly funded IT operations in Vermont, how successful IT projects are in meeting state needs, or how well state agencies follow defined protocols for procurement.
None of these conclusions would have been possible without structuring the database: shaping the information into rows and columns to see what was missing. Nor could the data work have been done without extensive traditional reporting to acquire and verify the information that comprised the dataset.
For people unfamiliar with data journalism, the methodology can seem deceiving. In many people’s minds, data means numbers: Can it really be a data project if there’s no math involved?
Resoundingly, yes.
And for newsrooms unaccustomed to investigative projects, the stamina required for such an endeavor can be hard to muster. Some projects take a lot of resources and a long time: Is the story really going to be worth the cost and the trouble?
Sometimes.
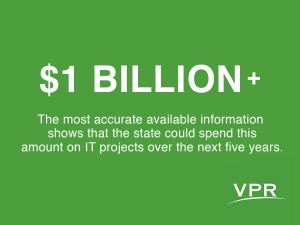
Vermont Public Radio’s project on state IT spending was a success on many fronts. We had trusted it would be, based in part on the sheer volume of taxpayer money at stake — at least $1 billion in the next five years. The newsroom’s commitment to follow-through also stemmed from anecdotal grumblings at the Statehouse about IT oversight, and several spectacular IT failures for the state in recent memory. We knew there would be a story.
But not every tangle of information is going to be worth picking apart. To assess the potential for a narrative database, ask yourself the following questions (in addition, of course, to universal considerations of newsworthiness and timeliness):
- Can the data can be categorized? Without categories, there is no structure. You might have a good story on your hands, but not necessarily a good data-driven one.
- Is missing information meaningful? If there will be holes in the final database, the mere presence of that information’s absence may — or may not — point to a story.
- Do you know what you’re looking for? Before committing to a structured information database project, you should articulate a good reason to bother. Develop a solid hypothesis, supported by documented evidence and/or reliable leads.
- Will the database be worth mining? In the event your lead story doesn’t pan out, you’ll want to know that even an unpublished database will be valuable for the story ideas it can generate.
On the latter point, it’s interesting to note VPR’s choice of what to do with the database our project produced. It absolutely was worth mining for individual stories within the list of pending, cancelled and completed IT projects, alike. The newsroom is in the process of following up with related news coverage.

Available records, interviews and information from dozens of documents comprised a comprehensive database of IT projects within Vermont’s state government, revealing glaring gaps in accountability.
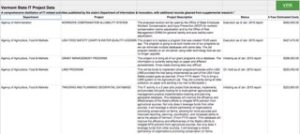
But rather than keep this gold mine for itself, VPR followed its public service mission and opted to publish the database for all to see. We created a pared-back version on a simple Google spreadsheet that can’t be edited, and linked to it from the story. We didn’t get the pie charts we expected, but perhaps more than just our own coverage will stem from our work and this open source ethos.
I believe this type of sharing and interactivity is part of what energized VPR audiences to engage with the story as much as they did. We received generous feedback from a variety of sources that not only reinforced the reasons behind our commitment to covering the state’s IT spending, but that also led to deeper insights and additional leads for related investigations.
You can check out Taylor Dobb’s report here, and the simple database with a not-so-simple history here.
Do you have experience with or questions about treating narrative information as data? Do you have your own related projects to share? Feel free to comment below, or drop me a line.

