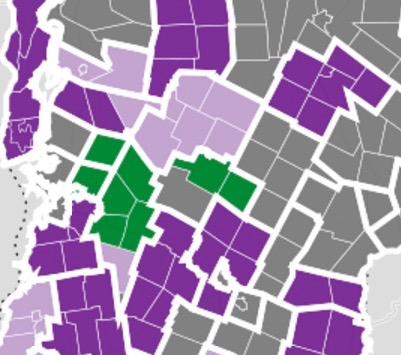
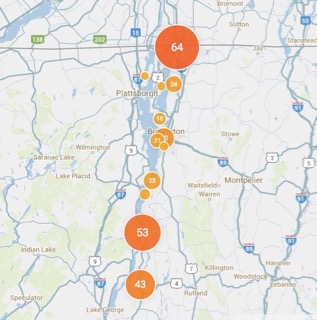
Mapping Education Reform in Vermont
This real-time map shows the current status of 250+ school districts undergoing consolidation.
This real-time map shows the current status of 250+ school districts undergoing consolidation.
435 square miles of lake, 630 metric tons of phosphorus and one controversial plan to clean it up.

As the Vermont Legislature works to overcome a $100 million budget gap for fiscal year 2016, one of its largest fiscal liabilities remains outside the reach of the annual budget bill. The state gives up about $1 billion in tax breaks annually through policies that have remained largely unchanged in recent years, even as lawmakers struggle to balance budgets.
Unlike state spending, most of the tax breaks are permanent – unless they’re amended. They’re not voted up or down annually like the budget. But every two years, the state tallies how much money it’s not collecting. Here’s the latest glimpse of who gets to keep it.
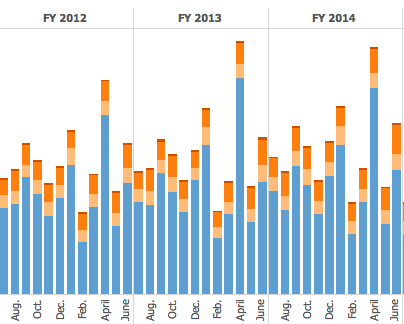
State revenue data is released officially in a PDF format that limits the public’s opportunity to analyze the health of Vermont’s income streams.
This ongoing, interactive data visualization, created from official sources and updated monthly with some exceptions, provides four years of actual revenues in the state’s major funds.
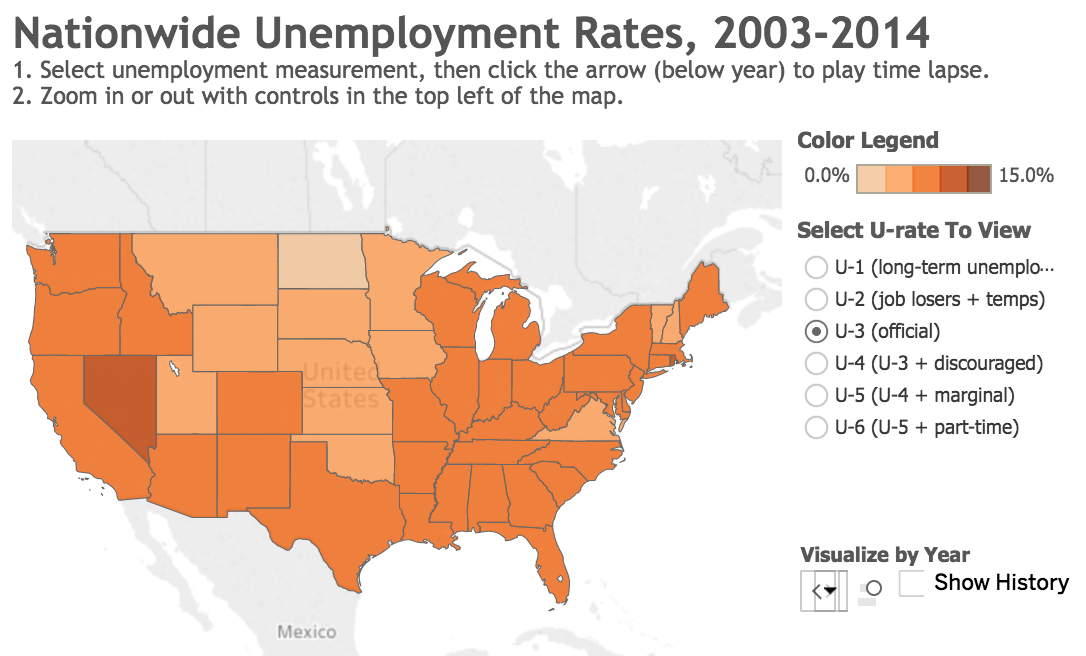
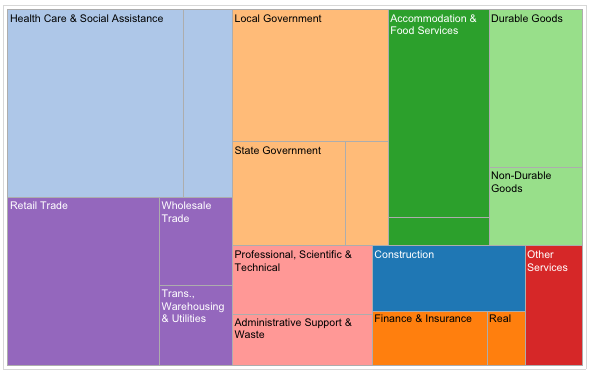
Amid election-season rhetoric and political spin about jobs, this series of data visualizations documented labor statistics over time and across sectors, with both county-level detail and nationwide context. I conceived and designed the series, wrangled and analyzed the data, and wrote accompanying explanatory stories.
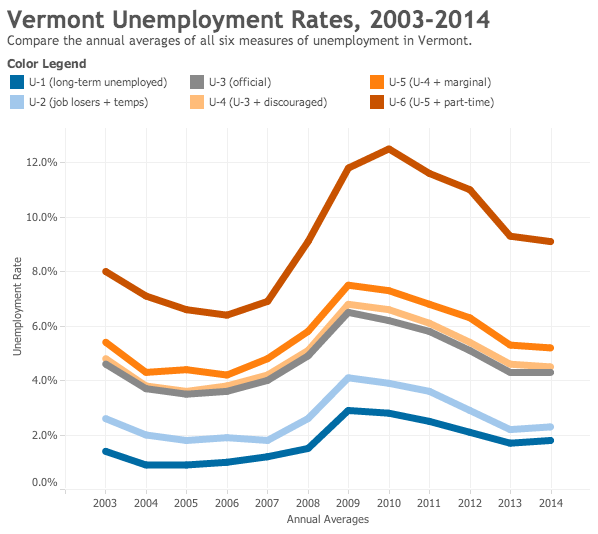
Vermont’s official unemployment rate may be approaching pre-recessionary lows, but when part-time and other marginally attached workers are factored in, the rate has been slower to budge.
Visually compare not just the official unemployment rates, but all six measures of unemployment in Vermont and around the country with three interactive graphics.
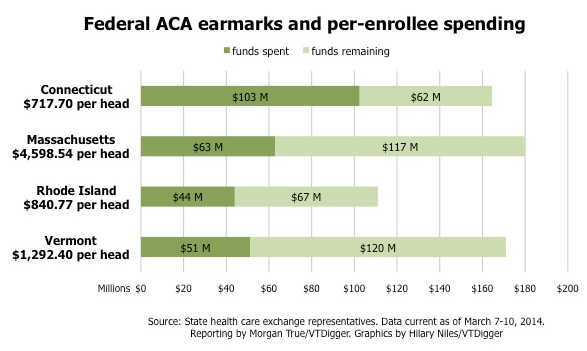
VTDigger.org By Morgan True, with graphics by Hilary Niles Health care reporter Morgan True assesses the impact of the Affordable Care Act in the six… Read More »Charting the Affordable Care Act in New England
December brought good news and bad news for Vermont’s jobs picture: The unemployment rate dropped again, but so did the labor force.
Reporting by Andrew Stein, data visualizations by Hilary Niles / VTDigger.org
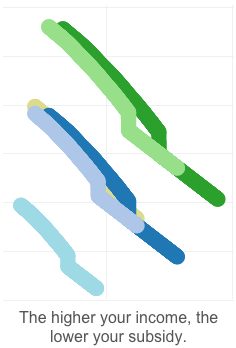
Three interactive information graphics produced to accompany a user’s guide to the new state healthcare exchange in Vermont.
A rare breed among American states, Missouri sets no limit to campaign finance contributions in political races. But all that money must be disclosed. So we tracked it.
In Fall 2012 elections, I led the Columbia Missourian’s government reporters in a coordinated effort to harvest and report the campaign finance earnings and expenditures reports of 33 candidates for 14 state and local races. I also helped coordinate efforts with other desks in the newsroom as we worked together to publish a complete set of graphics and a comprehensive online, searchable database of all contributions.
This was all set up for a night-turn project with well over 30 staffers on-deck. We produced and published all of the October quarterly reports the same night they were due to the Missouri Ethics Commission. Two weeks later, for the reports due eight days before the election, we prioritized the races and released the reports in batches.
While none of the reporting bears my name, this accomplishment is an important part of my portfolio because I took responsibility for developing its systems and execution.