1302 words, 7 charts / Vermont Public Radio
Data-driven exploration and explanation of Vermont’s $1 billion annual tax expenditures that remain on the books with little scrutiny.
By Taylor Dobbs (Vermont Public Radio) and Hilary Niles (Niles Media), with web production by Angela Evancie (Vermont Public Radio). Illustration by Aaron Shrewsbury. Graphics by Hilary Niles, based on data from Vermont Tax Expenditures Reports, 2006-2015.

As the Vermont Legislature works to overcome a $100 million budget gap for fiscal year 2016, one of its largest fiscal liabilities remains outside the reach of the annual budget bill. The state gives up about $1 billion in tax breaks annually through policies that have remained largely unchanged in recent years, even as lawmakers struggle to balance budgets.
Vermont isn’t alone on that front. Robert Zahradnik is the director of state fiscal health for the Pew Charitable Trust, and he says the majority of states don’t tend to keep close track of these tax breaks or measure their efficacy.
Additional related reporting:
Vermont’s Shadow Budget: State Tax Breaks Get Little Scrutiny // Feb. 9, 2015 // by Taylor Dobbs
Vermont’s Shadow Budget: It’s Hard To Know If Tax Breaks Are Working // Feb. 12, 2015 // by Taylor Dobbs and Hilary Niles
Known as “tax expenditures,” the impact of these tax breaks is the same as money spent. Think of it like an instant rebate: Instead of accepting the revenue and then handing it back out in the form of subsidies or payments, the state simply never collects certain revenues. The effect is the same.
A special commission in 2011 referred to this foregone revenue as a “shadow budget” that lacks sufficient transparency. And Zahradnik says tax expenditures don’t typically get the same level of scrutiny as the annual budget.
“We looked at this issue back in 2012 and released a report called Evidence Counts that found that most states really weren’t producing the kind of information that can ensure tax incentives – those tax expenditures focused on economic development … And since that time, we’ve been working with states to put in better practices,” he said.
Tax expenditures come in the form of policies and programs such as tax credits, exemptions, deductions or modified tax rates. Common at both the state and federal levels, they’re designed to encourage certain activities or lower the tax burden for certain populations. Such tax breaks are available for individuals and businesses, and virtually everyone in Vermont enjoys at least a few.
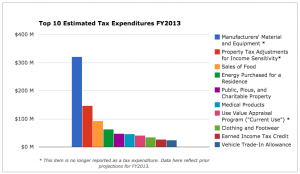
Common at both the state and federal levels, tax expenditures are designed to encourage certain activities or lower the tax burden for certain populations. Virtually everyone in Vermont enjoys at least a few.
Vermont is one of many states, Zahradnik says, that has taken a renewed interest in tax expenditures in recent years.
“There wasn’t always an opportunity for them to be reviewed in the same way that other programs are,” he said. “And I think on top of that, when you had the Great Recession and the fiscal crisis, our sense is there was just much more attention being paid to every dollar that state governments spend, and how do you make sure you’re making decisions that are based on evidence and that are based on an actual review of which programs are working and which ones are not?”
Vermont is ahead of some other states, he said, in that the state has defined measurable goals for all of its expenditures. But the state has not yet put significant effort into measuring progress against those goals or modifying policy to better reach them.
These tax “preferences,” as they’re also sometimes called, are divided into five broad categories based on which tax revenues are foregone: sales and use, income, property, motor fuel and vehicle and banking and insurance.
And unlike state spending, most of the tax breaks are permanent – unless they’re amended. They’re not voted up or down annually like the budget. But every two years, the state tallies how much money it’s not collecting. Here’s the latest glimpse of who gets to keep it.
Sales and Use
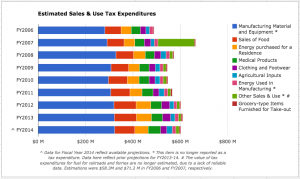
Vermont manufacturers don’t have to pay taxes on their input materials or equipment. For individuals, there’s no tax on most groceries, residential energy purchases or clothing.
Sales and use taxes are the most visible form of taxation in the state. Virtually every time someone pays for goods or services, the state gets a small piece of that money. This category is also where the state gives up the most revenue in tax breaks each year, most of it (an estimated $339.1 million* in FY 2014) to manufacturers and other producers.
Manufacturers, including just about any company that produces tangible goods, don’t have to pay taxes on their input materials or equipment. So if a sock manufacturer is expanding its factory, it won’t have to pay for taxes on all the new fabrics or machines it buys. Manufacturers also don’t pay taxes on the energy they use in the manufacturing process.
The state does this to make it easier for manufacturers, which employ about 31,700 Vermonters, according to most recent estimates, to operate in the state by reducing overhead costs.
Tax breaks for individuals make up a significant portion of the sales and use expenditures as well. There’s no tax on most groceries, residential energy purchases or clothing, and those tax breaks make up $174.7 million of FY 2014’s foregone revenue from sales and use taxes.
Property
- Total Expenditure (FY 2013): $281,080,500*
- Portion of overall tax xxpenditures: 28 percent
- Largest tax break: property tax adjustments for income sensitivity ($146,850,000*)
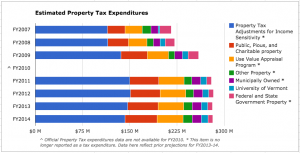
Including land such as church grounds, parcels in Current Use, and government-owned properties, property tax expenditures total about a quarter of the state’s tax breaks.
Income sensitivity adjustments on statewide property tax bills also save Vermont taxpayers big, lately to the tune of about $145 million* a year — and that’s not counting tax breaks for public, religious and charitable organizations, or for landowners whose farm or forestland is enrolled in the state’s Current Use.
Including land such as church grounds, parcels in Current Use, and government-owned properties, property tax expenditures total about a quarter of the state’s tax breaks.
It’s also one of the few categories of tax breaks that’s made its way into the latest round of budget discussions. In Gov. Peter Shumlin’s third inaugural address in January, he proposed revoking farmers’ Current Use status if they repeatedly fail to comply with state water quality standards.
Income
- Total expenditure (FY 2013): $59,744,000
- Portion of overall tax expenditures: 6 percent
- Largest tax break: earned income tax credit ($26,884,000)
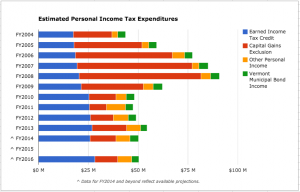
The personal exemptions and standard deductions individuals claim on their annual income tax returns add up to more than half of all income tax breaks in Vermont. Note: Income tax expenditures from one tax year are reported for the following fiscal year.
It’s people, not companies, who find the most savings from income tax expenditures. The personal exemptions and standard deductions individuals claim on their annual income tax returns add up to more than half of all income tax breaks in Vermont.
Vermonters get income tax breaks for a wide range of things, from low income families’ spending on daycare ($61,000 in FY 2013) to saving for college ($1,777,000 in FY 2013).
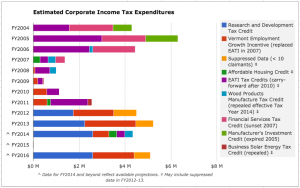
Corporate tax breaks make up a much smaller portion of this category – just $5,238,000 in FY 2013, though they vary dramatically year to year (they totaled less than half a million dollars in FY 2009). Note: Income tax expenditures from one tax year are reported for the following fiscal year.
Corporate tax breaks make up a much smaller portion of this category, though they vary dramatically year to year.
Lately, most savings for corporations comes from either the Vermont Employment Growth Incentive (a cash incentive for high-paying job creation) or the Research and Development Tax Credit (designed to encourage innovation in Vermont).
Banking and Insurance
- Total expenditure (FY 2013): $29,231,800
- Portion of overall tax expenditures: 3 percent
- Largest tax break: hospital and medical service organizations ($14,070,800)
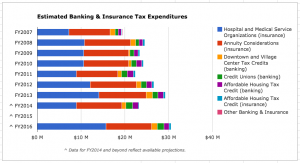
Most tax savings available for the banking and insurance industry go to hospital and medical service organizations in an effort to keep down the cost of health care in Vermont.
Most tax savings available for the banking and insurance industry go to hospital and medical service organizations in an effort to keep down the cost of health care in Vermont. And for about $10 million, some annuity considerations are exempted for insurance companies.
Banks pick up less than $4 million through other tax policies, including an incentive to invest in affordable housing.
While tax breaks in this category are expected to top $30 million in the coming fiscal year, overall they account for a small portion of total tax expenditures in the state.
Motor Fuel and Vehicle
- Total expenditure (FY 2013): $28,420,000*
- Portion of overall tax eexpenditures: 3 percent
- Largest tax break: trade-in allowance ($24,700,000)
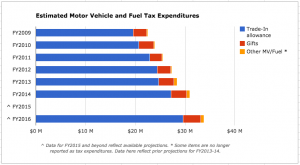
The vehicle trade-in allowance ensures vehicles are only taxed once (when they’re bought) rather than twice (if they’re traded in). Note: Diesel tax expenditures for FY2009-12 are excluded from these calculations due to unreliability of previously reported data.
The vehicle trade-in allowance ensures vehicles are only taxed once (when they’re bought) rather than twice (if they’re traded in). This accounts for virtually all of the tax breaks in the motor vehicle and fuel category. Other tax breaks limit the costs of certain vehicles for religious and charitable organizations, veterans and people with disabilities.
There is also a tax break for diesel fuel used for farm equipment and other off-road uses. That tax break has been inaccurately reported in past years, but the accurate figure came in around $333,000 in FY 2013.
Editor’s note: The data presented here reflect state estimates reported by Vermont’s Joint Fiscal Office and Department of Taxes in annual or biennial tax expenditure reports since 2006. Some tax expenditures are not estimated due to unavailable data. Additionally, methodologies for estimating these values have evolved, and the details of several tax expenditures have been amended in the intervening years. As a result, the comparison over time cannot be exact, but is presented here as accurately and fairly as possible with the best available data.
* Beginning with the state’s 2015 Tax Expenditures Report, certain items are no longer reported as tax expenditures. Some FY2013 values have been estimated as an average of prior projections for Fiscal Years 2012 and 2014.
